

Ever since we moved to our farm I have had the idea of going off-grid. The thought of being self-sustaining at least on the power and heating is extremely appealing to me. And in these troubles times it seems like an even better idea to get going.
So, follow me on the first step of this new exciting journey towards the ultimate goal: off-grid electricity!
First things first – I have no experience on this field whatsoever. So the first thing I did was to call a good friend. He’s working on electrical vehicles and knows a thing or two about the ‘powerwall’ concept. especially building stuff like this from the ground up.
Putting a bunch of solar cells on the roof and hooking up a battery seems fairly easy but of course there’s much more to it than that. Step 0 for me is to find out what the current power use really is.
A long time ago I read a blog (https://ing.dk/blog/elmaaling-194924) and saw the device for measuring everything related to the electrical installation – The Eastron SDM630V2.
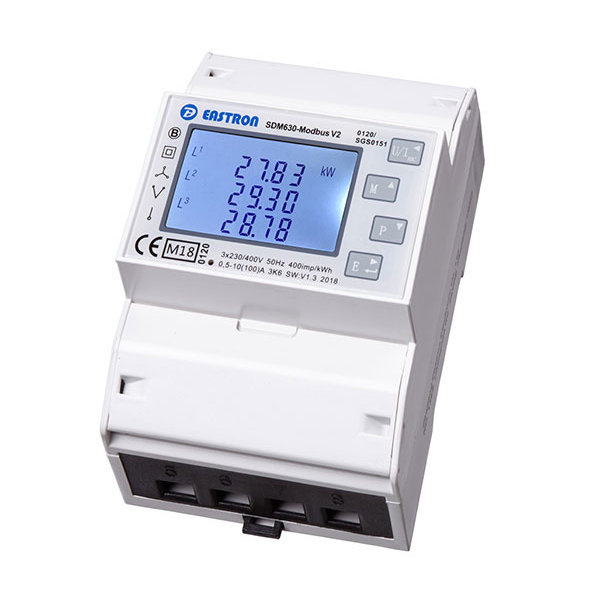
Nothing fancy on the outside – but it has MODBUS!
This means that I should be able to hook it up to some device for reading all the interesting values. Great!
Fast forward a year or so. I had finally booked an electrician for improving the installations – changing the whole main breaker box and upgrading the breakers from ceramic fuses to actual breakers. also removing a weird and VERY old 30A breaker in the middle of the breaker box which wasn’t used anyway (went to the barn to another breaker box which I had already disabled – pulled the fuses from).
So – long story short I got this thingamabob installed and just a few days ago I finally hooked a raspberry pi (I know, overkill!) up to it and started logging data!
A note on the RS-485 connection though
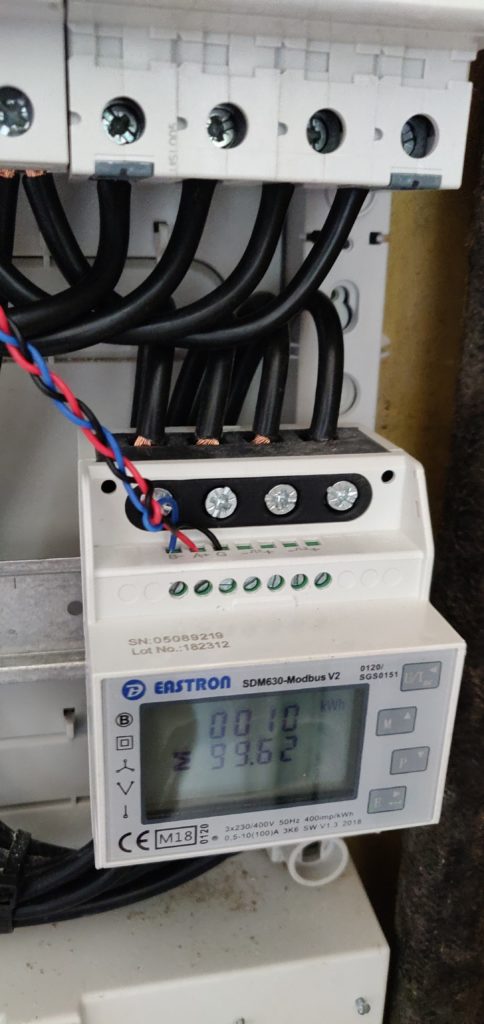
Do you think I was a little scared when mounting those signal wires? Those screws are in direct contact with the phases.. Yikes!
Anyway – I got the pi hooked up to a RS-485 converter I had. A small python script later (More on this in the next post) and I could start seeing data! Yay!
Now, I don’t have written anything about this but I think this deserves its own post as well – Grafana – a tool for visualizing database tables. I have set up these graphs, showing phase voltage,amperage and power as well as the frequency and total power consumed along with the current total usage.
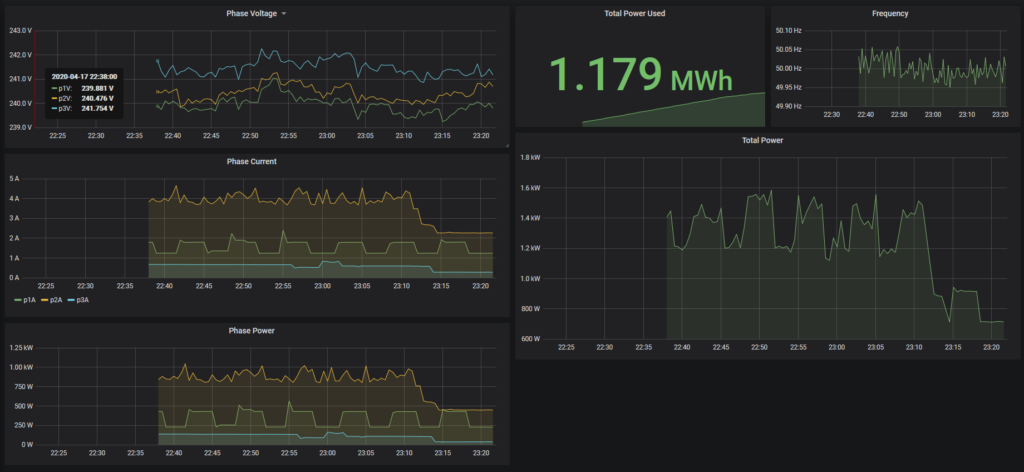
I can probably do loads of other things with this but for now it seems REALLY nice and very intuitive to setup (when done correctly)
Does this spark (hah, pun intended) your interest? Let me know in the comments!